
HARMONY
Harmonic & Classical Patterns. Automated.
HARMONY finds harmonic and classical chart patterns as they form, draws them on your chart with every pivot labelled and every ratio measured, and turns a completed pattern into a defined trade plan — entry, stop and targets — that it can execute automatically.
Built for NinjaTrader 8. Runs as an automated strategy inside your own NinjaTrader platform — you need NinjaTrader 8 and a market data feed.
What it is
A fully automated strategy built on chart patterns
Harmonic patterns and classical chart patterns are some of the oldest ideas in technical analysis. They are also some of the hardest to trade consistently by hand: the pivots have to be picked the same way every time, the ratios have to be measured exactly, and the plan has to exist before price gets there.
HARMONY does that work on the chart in front of you. It identifies the pattern, labels each pivot, measures the Fibonacci relationships between the legs, marks where the pattern completes and where it stops being valid, and builds the trade from there.
The approach
Patterns you can see. Rules you can check.
Nothing about a HARMONY trade is hidden. The pattern it traded is drawn and named on the chart, the ratios that qualified it are printed on the legs, and the entry, stop and targets are on screen as levels before the order goes in.
You configure how much confirmation it needs before entering, how stops and targets are calculated, and how a position is managed from T1 to T3. The system applies those rules the same way every time.
The pattern library
Harmonic and classical, in one system
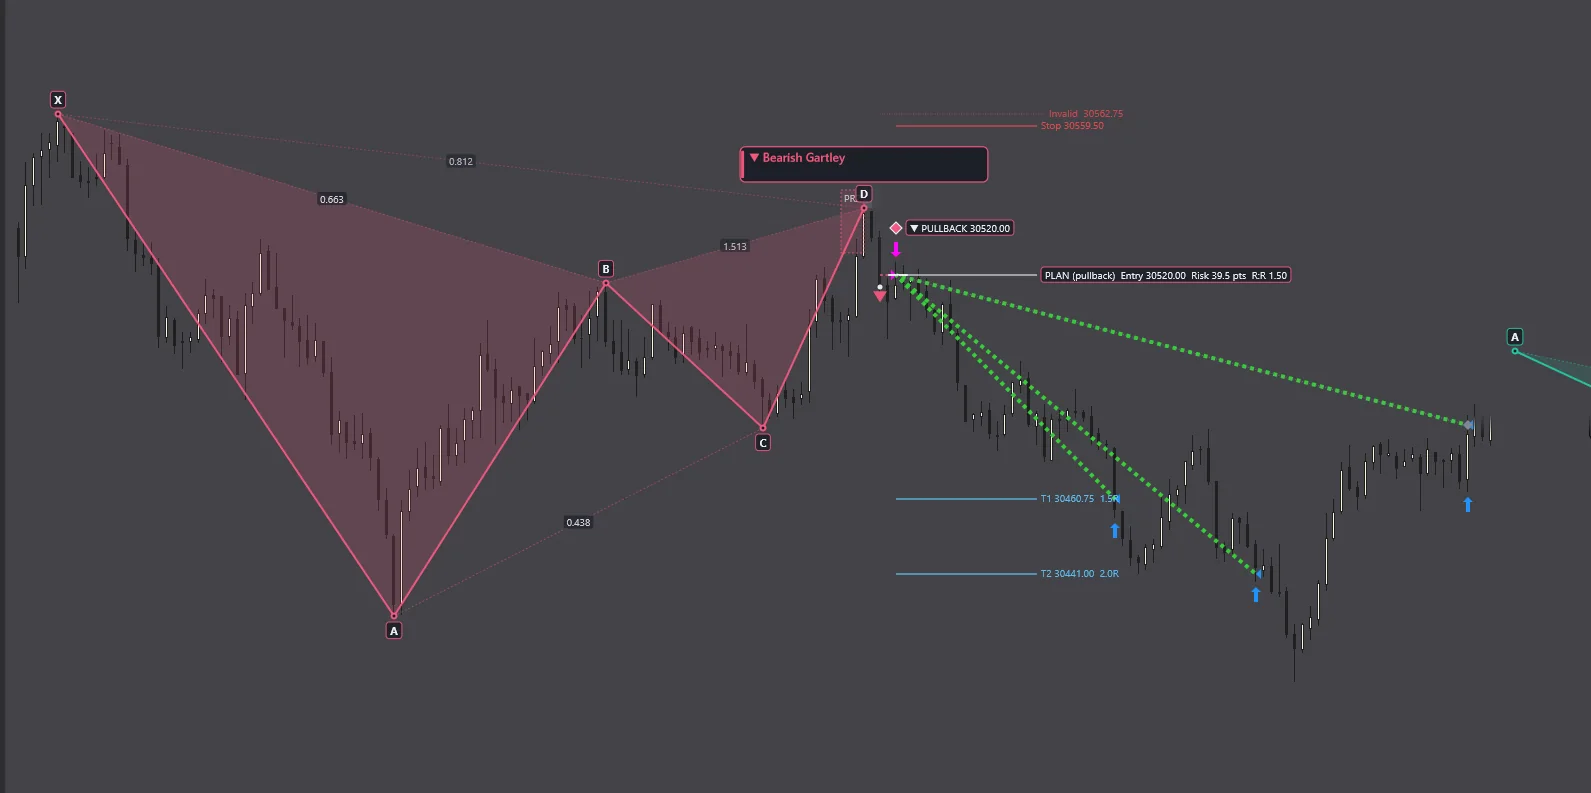
Two families of patterns, drawn the way HARMONY draws them — bearish in rose, bullish in green — with the pivots it labels on your chart.
Harmonic patterns
Precise Fibonacci relationships between each leg. The pattern is only valid when the ratios line up.
Gartley
B at 0.618 of XA. D completes at 0.786 of XA.
Bat
Shallow B, 0.382–0.50 of XA. D completes deep, at 0.886 of XA.
Butterfly
B at 0.786 of XA. D extends beyond X, at 1.27–1.618 of XA.
Crab
B at 0.382–0.618 of XA. D extends to 1.618 of XA — the deepest of the group.
Shark
A five-point structure that completes at 0.886–1.13 of the 0–X leg.
Cypher
C pushes past A, at 1.272–1.414 of XA. D completes at 0.786 of XC.
AB=CD
The CD leg mirrors the AB leg in price and time.
And other supported harmonic patterns
Each detected pattern is named on the chart, so you always know which one HARMONY is trading.
Classical patterns
Reversal and continuation structures, with the neckline or channel that confirms them.
Head & Shoulders
A higher peak between two lower ones. The neckline confirms the break.
Inverse H&S
The mirror image at a low: a deeper trough between two shallower ones.
Double Top
Two tests of the same high, then a break of the low between them.
Double Bottom
Two tests of the same low, then a break of the high between them.
Bull Flag
A strong move up, a short orderly pullback, then continuation.
Bear Flag
A strong move down, a short orderly bounce, then continuation.
Pennant
A sharp move, then a small converging triangle before the next leg.
And other supported classical patterns
Reversals and continuations, identified and drawn the same way.
The ratios shown are the textbook definitions of each harmonic pattern.
Beautiful chart drawings
Every pattern, drawn and named
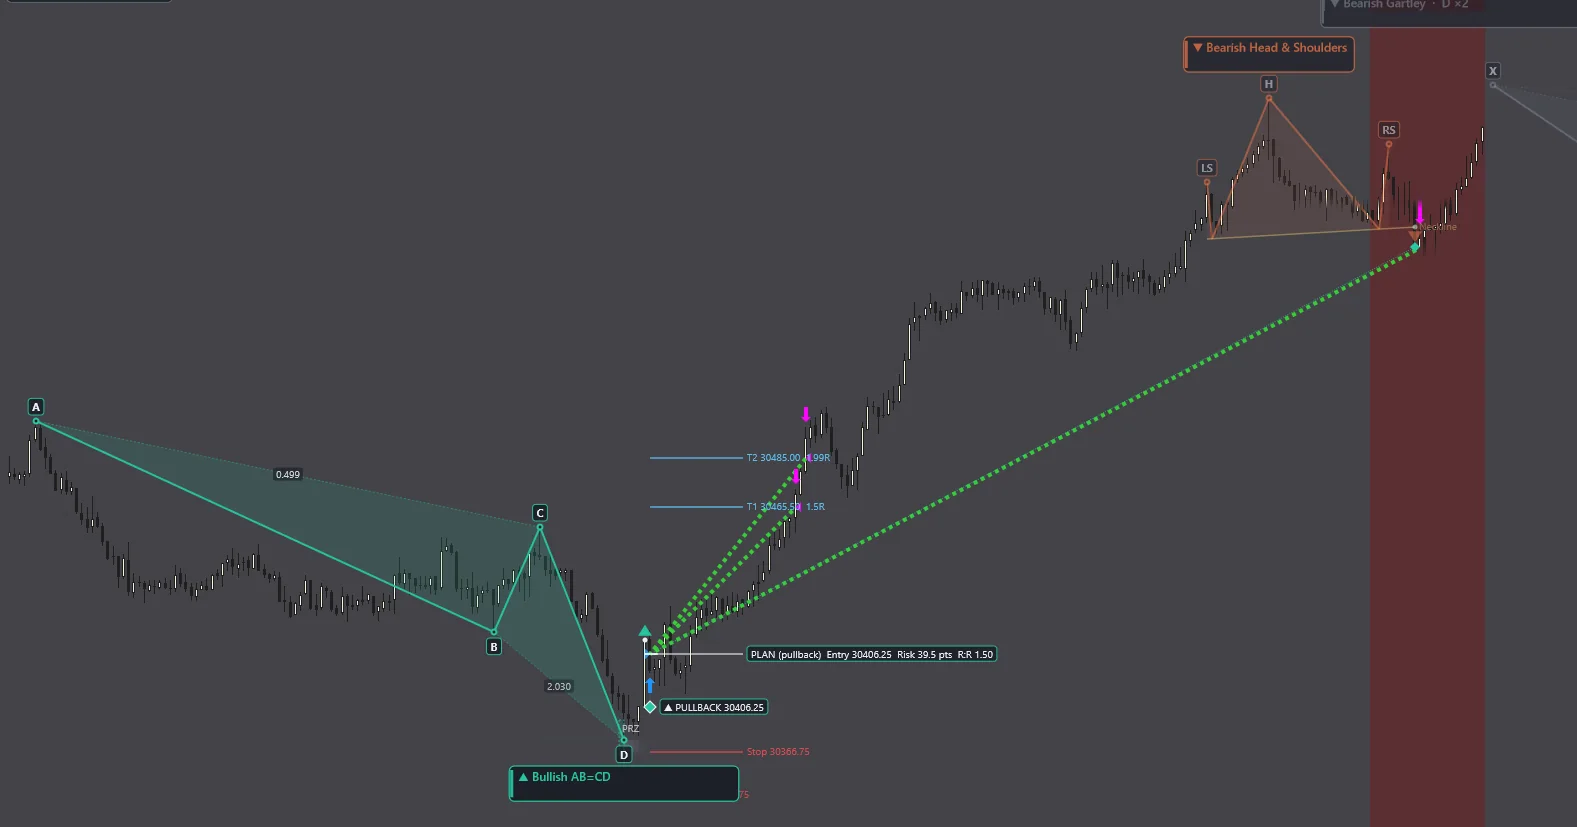
HARMONY doesn’t just enter a trade. It shows you why. Each pattern is drawn on the chart in its own colour, shaded between its legs, with every pivot labelled — X, A, B, C and D for harmonics; left shoulder, head, right shoulder and neckline for classical patterns.
- Coloured, shaded pattern drawings — bullish and bearish at a glance
- Labelled pivot points on every pattern
- The pattern’s name and direction on the chart, beside the pattern it belongs to
- Harmonic and classical patterns side by side on the same chart
Fibonacci, measured for you
The ratios are on the chart, not in your head
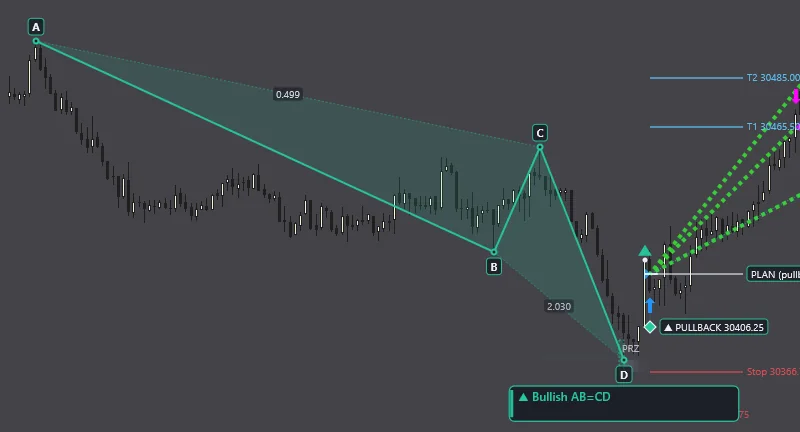
Harmonic trading lives or dies on measurement. HARMONY measures the Fibonacci relationship of every leg and prints it on the leg it describes, so you can check a pattern at a glance instead of dragging tools across the screen.
Fibonacci price measurements
Retracements and extensions between pivots, labelled on each leg.
Time projections
Where in time a pattern is expected to complete, not only where in price.
Pattern-expiration zones
A pattern that takes too long or travels too far stops being the same pattern. HARMONY marks where it no longer counts.
From pattern to trade
A plan on the chart before the order goes in
When a pattern completes, HARMONY builds the trade as levels you can see: where it enters, where it is wrong, and where it takes profit.
- 01
Detect
The pattern forms. HARMONY labels the pivots and measures each leg.
- 02
Qualify
The ratios are checked, and the reversal zone and the invalidation level are marked.
- 03
Confirm
The entry waits for the confirmation you configured — for example a pullback into the entry price.
- 04
Plan
Entry, risk in points, R:R, stop and T1/T2/T3 are calculated and drawn.
- 05
Manage
Targets are worked in stages and the runner is managed by your rules.
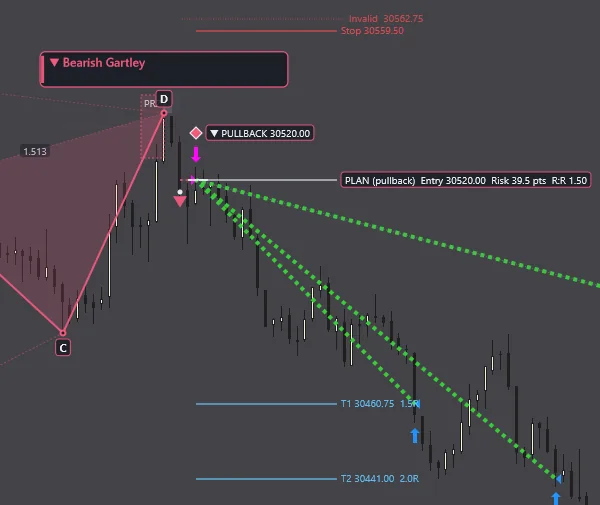
Automated entries
Entry, with the confirmation you choose
HARMONY can enter automatically as soon as a pattern qualifies, or wait for confirmation first — the capture here shows a pullback entry, placed after price came back to the planned level.
The plan line spells out the trade before it exists: the entry price, the risk in points and the reward-to-risk the targets were built from.
- Automated entries
- Configurable confirmation
- Pullback entries
- Invalidation levels
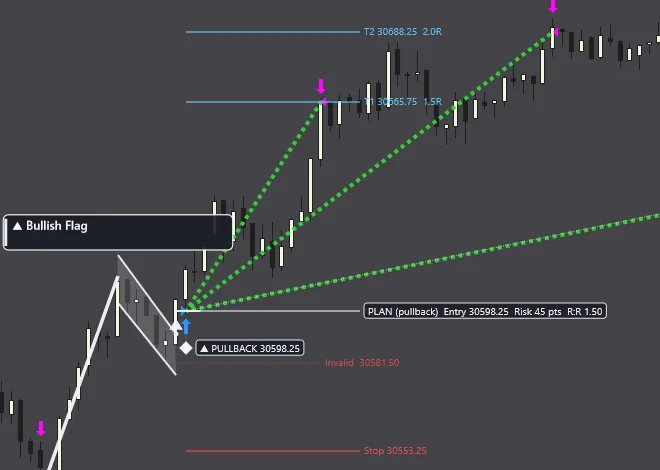
Stops, targets and R
Risk you define, calculated for you
Choose how HARMONY places stops and targets, and it does the arithmetic. Risk is calculated in R automatically, so a target is always expressed against what the trade is risking.
Stops & targets
- ATR-based
- Fibonacci
- Swing
- Structural
Trade management
- Automatic R calculation
- Target-driven stops
- Stop-driven targets
- T1 / T2 / T3 management
Target-driven stops size the stop from the targets you want. Stop-driven targets place the targets from the stop. Either way, every level is drawn on the chart.
Gallery
HARMONY on the chart
Real NinjaTrader 8 captures. Select any image to open it full size.
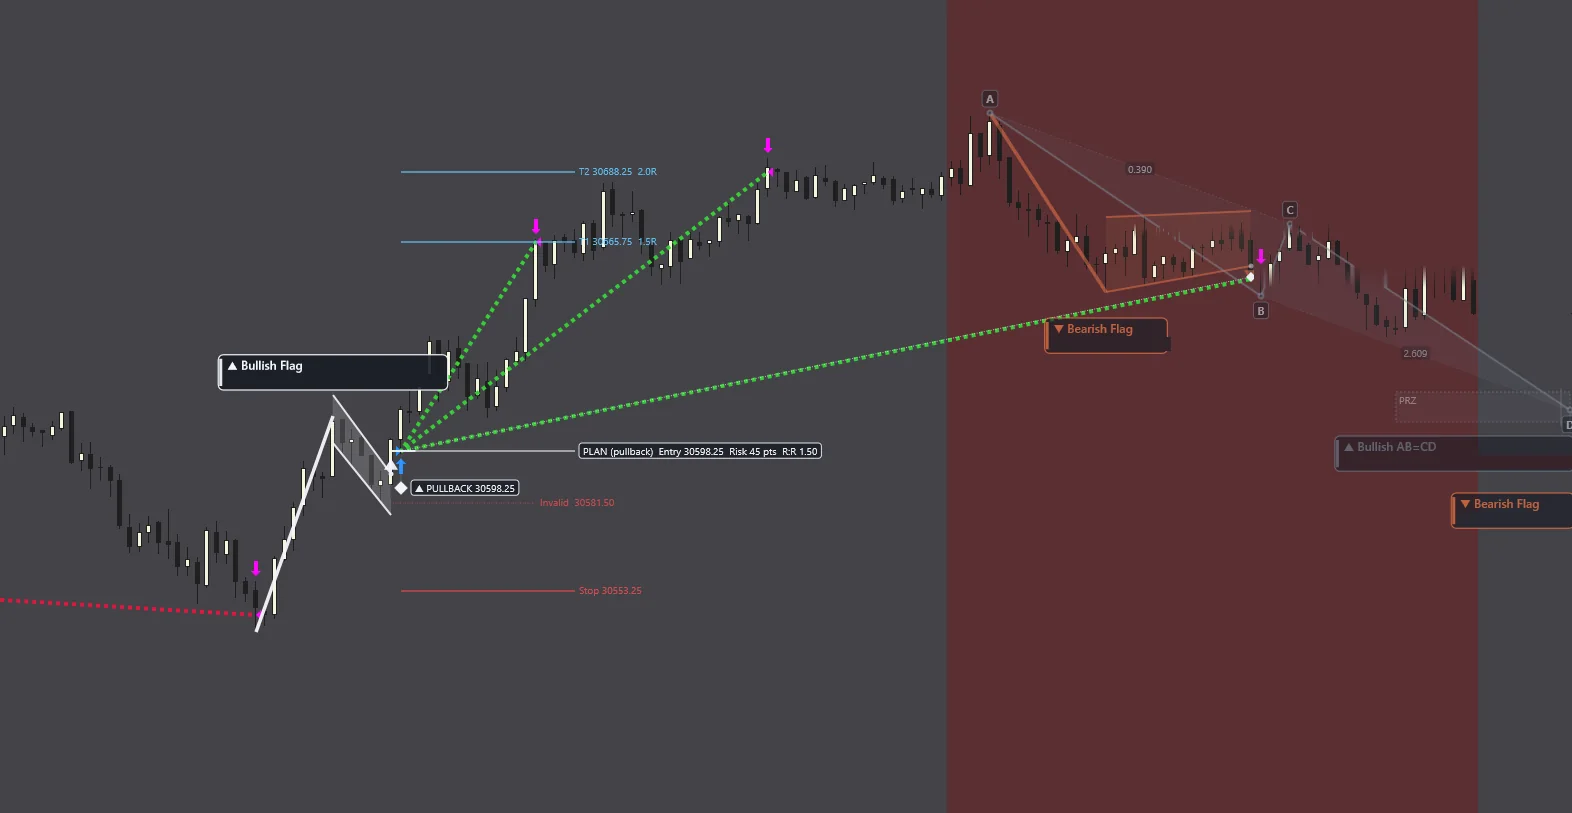
Chart: HARMONYNinjaTrader 8Trade-outcome labels hidden
Chart captures of historical price action. They show how the system draws patterns and plans and manages trades on a chart — they are not performance results, and they say nothing about future results. The outcome labels HARMONY prints after a trade closes have been removed from these images.
Hypothetical / simulated performanceHypothetical results have inherent limitations and do not represent actual trading results. Past performance does not guarantee future results. Full Risk Disclosure →
Who it may be for
HARMONY tends to suit traders who…
Characteristics only. Nothing here is a prediction about how any account will perform.
Your trade. Your choice.
Automated doesn’t mean locked in.
Run the strategy automatically or use it manually. When a trade is live, you can still exercise your own discretion — tighten a stop, adjust or extend a target, take the trade off, or hold it longer.
The system gives you the rules. You decide how much control you want to use.
Getting set up
Set yourself up. Get help when you need it.
Your membership gives you the files, templates and step-by-step instructions to get your system running on your own. It also includes a free 60-minute setup and review session if you have questions, missed something, or want to double-check your configuration.
Open the Strategy Dashboard in the Member Hub and download the Install and Activate guide, the StratGeeks Licences add-on and the package and templates for your system.
Follow the guide in order: import into NinjaTrader, paste your licence key from My Account, load a template and confirm the system is running.
A free 60-minute session with every membership. Work through questions, cover anything you may have missed, and confirm everything is configured correctly.
Keep up with updates, new templates and files, announcements and the member community.
Free 60-minute setup & review session
Included with every membership. For questions, troubleshooting, anything you may have missed, and a check that your configuration is right. Day-to-day setup and strategy questions also go to the support channel in the Member Hub, where the answers stay visible for everyone.
Additional private 60-minute session
Booked separately, for deeper optimisation help, extra configuration work or ongoing assistance beyond the included setup and review session.
The indicator on its own
The HARMONY Patterns Indicator — $99 a month
Want the patterns without the automation? The HARMONY Patterns Indicator finds the harmonic and classical patterns HARMONY is built on and draws them on your chart, with the pivots labelled and the ratios measured. It places no trades — what you do with a pattern is up to you.
What you get
- Harmonic and classical patterns found and drawn on your chart
- Labelled pivots and the pattern’s name beside it
- The setup guide, files and updates in the Member Hub
- Your own licence key, managed in My Account
Already included
- With every HARMONY strategy subscription
- In every StratGeeks Suite plan
The free 60-minute setup session is not included with the indicator on its own.
Indicator, not a strategyThe HARMONY Patterns Indicator shows patterns on a chart. It does not place, manage or recommend trades, and a pattern on a chart says nothing about future results. Full Risk Disclosure →
Results
See HARMONY on the Strategy Dashboard
Every HARMONY template, updated each week — 20 templates. Pick any template, change the period, or run several together to see how they combine.
Leading long-run template · last 30 days
Night · 1-minute chart · entries 20:00-03:59 · out by 04:59, before any Day entry · can run together with the Harmony DAY template of the same set (never with a Night + morning template)
Long-run 2026 · Standard size · 1 long / 1 short MNQ · Sep 24, 2026 to Oct 23, 2026
Open this template Same template, all of 2026 →- Net (simulated)
- $861
- Max drawdown
- $448
- Trades
- 50
- Winners
- 52%
Hypothetical / simulated performanceIndependent simulated replay estimate. Not a NinjaTrader-certified backtest and not live trading. Hypothetical performance results have many inherent limitations. These results come from a simulated replay of the strategy on historical market data. They are not results of live trading and do not include slippage. Simulated results are prepared with the benefit of hindsight and cannot account for the impact of real market conditions or the financial risk of actual trading. No representation is being made that any account will or is likely to achieve profits or losses similar to those shown. Futures trading involves substantial risk of loss and is not suitable for every investor. Past performance, simulated or actual, does not guarantee future results. Past performance does not guarantee future results. Full Risk Disclosure →
Subscription options
Get HARMONY
Choose this system, or get the whole lineup.
This system
HARMONY
Harmonic and classical patterns, fully automated. Billed monthly, cancel any time.
- Official templates
- Optimised configurations
- Free strategy updates
- Member Hub access
- Free 60-minute setup & review
- The HARMONY Patterns Indicator, included
HARMONY only
The StratGeeks Suite
Every system, one membership
HARMONY plus every other StratGeeks product — ORS: Fusion, AXIOS, ECHO, RECON, HARMONY, the PRISM indicator and the HARMONY Patterns Indicator now, new StratGeeks systems the day they are released, and every product released while your term is active.
- Everything in the individual subscription
- Every StratGeeks system, not just this one
- New systems as they are released
$495 a month gets you HARMONY. $795 gets you every StratGeeks system — HARMONY included — for three months. Which one makes sense depends on whether you want one approach to the market or all of them.
Questions
Before you decide
What do I need to run it?
NinjaTrader 8 and a market data feed. If you do not have them yet, we will point you at what you need before you buy, not after.
Is HARMONY included in the Suite?
Yes. Every Suite plan includes HARMONY alongside ORS: Fusion, AXIOS, ECHO, RECON, the PRISM indicator and the HARMONY Patterns Indicator. You can also subscribe to HARMONY on its own for $495 a month.
Can I get just the pattern drawings?
Yes. The HARMONY Patterns Indicator draws the harmonic and classical patterns on your chart without placing any trades, for $99 a month on its own. It is included with every HARMONY strategy subscription and every Suite plan. See the indicator →
Do you offer a trial?
No, and there is an explanation on the FAQ page rather than a vague answer here. The short version: a few days of live market conditions tells you very little about a rule-based system, and it is not a fair test in either direction.
Can I run it on a prop-firm account?
HARMONY can be configured to match a trading plan, including how entries are confirmed and how stops and targets are set. Whether any specific firm permits automation is a question for that firm.
What happens straight after I subscribe?
Everything you need is waiting in the Member Hub — the setup guide, the strategy file and the official template. Most people work through it themselves. Your included 60-minute setup and review session is there to check the result and answer whatever came up.
Want to talk to a real person?
You don’t need to talk to us to get started. But if you want to, we’re here.