How we build
Testing matters because live trading matters.
What is the point of automation if you cannot trust the backtest? Very few vendors spend any time explaining why their backtests should be trusted in the first place. This page is that explanation.
The principles
Three things every system is held to
Defined rules
Every strategy is built from rules you can read, configure and test. You can see what it is doing and why.
Real market data
Testing is done on traditional candlestick charts, using actual market movement rather than artificially constructed price data.
Realistic execution
We use limit and market orders based on what the strategy needs, so testing reflects how orders are expected to fill.
Chart types
Candlestick charts only
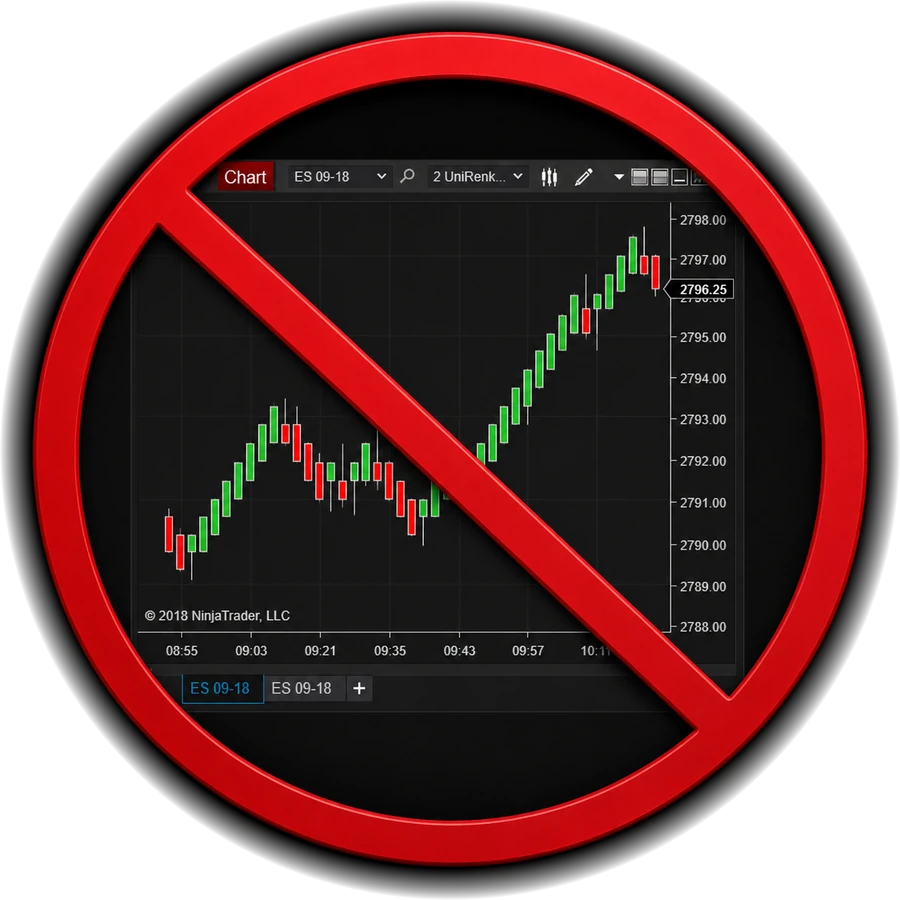
All StratGeeks testing is performed on traditional candlestick charts. We do not use:
- Renko bars
- Heikin Ashi bars
- Other synthetic chart types
These chart types can be useful for discretionary analysis, but the bars themselves are not actual market prices, and in backtesting that creates real distortion. Put simply: if the bars are not real, the backtest is not real.
By using traditional candlestick charts, testing is based on actual market movement rather than artificially constructed price data.
Order execution
Realistic order execution
Our strategies use a combination of limit and market orders depending on what the strategy needs. The goal is not to force one order type everywhere — it is to use execution methods that can reasonably be expected to behave similarly in testing and in live markets.
ORS: Fusion uses limit orders exclusively. AXIOS uses them for nearly all orders.
Trailing stops
No misleading trailing-stop optimisation
Some strategies can use trailing stops, but we generally avoid automatic trailing stops in published backtests, because many trailing-stop calculations cannot be accurately reproduced from historical data alone and can make results look considerably better than what is realistically achievable live. So we prefer:
- Fixed stops
- Fixed targets
- Clearly defined exit logic
The philosophy
Believable over impressive
Our goal has never been to produce the most impressive-looking backtest. It is to produce the most believable one. No backtest has ever been perfectly accurate — but a beautiful backtest is worthless if it cannot survive contact with the real market.
By focusing on traditional candlestick charts, realistic order execution, conservative assumptions, no synthetic chart types and no misleading trailing-stop optimisations, we build strategies whose historical performance has the best chance of reflecting real market behaviour.
Backtest and live
See it both ways
The same strategy logic, shown in testing and then in live execution — side by side, from the same system, the same settings and the same period.
Both charts are ORS: Fusion V2.7 on MNQ 09-26, 3-minute, over the same session. The backtest labels every entry, stop and profit with its price; the live chart shows the same strategy’s markers as it ran.
Hypothetical / simulated performanceHypothetical results have inherent limitations and do not represent actual trading results. Past performance does not guarantee future results. Full Risk Disclosure →
Configuration
Rules you can see, and settings you can actually change
Every StratGeeks strategy is built from defined rules you can read, understand and configure. There is no black box deciding what happens behind the scenes — you can see what the system is doing and why.
And there is a lot you can configure. Entries, exits, targets, stops, filters, position sizing and the rest of how a system behaves are all adjustable. The point is not to hide the complexity from you. It is to give you real control over a system that has been properly worked out.
The goal is simple: build and test the system we actually intend to trade.
Want to talk to a real person?
You don’t need to talk to us to get started. But if you want to, we’re here.
